
Quantitative, single-cell analysis of siRNA treatment using smFISH
Nucleic acid therapeutics are innovative drugs composed of DNA or RNA approximately 18–30 nucleotides in length.
They function by suppressing, modifying, or complementing the expression of disease-associated genes. In particular, siRNA therapeutics function by suppressing gene expression through sequence-specific degradation of target mRNA. Improving their pharmacokinetics and pharmacodynamics remains a critical design consideration.
During discovery and screening stages, both efficacy and delivery efficiency at the cellular level are often used as key indicators and are commonly assessed using real-time PCR. However, real-time PCR encounters technical limitations in distinguishing sequence-dependent gene silencing efficacy from cellular delivery efficiency, which hinders accurate performance evaluation.
This application note introduces a novel method utilizing smFISH (single-molecule fluorescence in situ hybridization), which enables RNA visualization at the single-molecule level, to distinctly report the knockdown efficacy and delivery efficiency of an siRNA treatment.
Keywords: smFISH, RNA imaging, General Analysis 3, siRNA therapeutics
Experimental overview
Human alveolar basal epithelial adenocarcinoma cell line A549 cells (JCRB Cell Bank, JCRB0076) were seeded in a 96-well plate for smFISH and real-time PCR analysis. The cells were incubated for 20 to 24 hours. Subsequently, the cells were transfected either negative control siRNA (4390843, Thermo Fisher Scientific) or GAPDH siRNA (439084, Thermo Fisher Scientific). Then, 20 to 24 hours post-transfection, smFISH or real-time PCR was performed, as outlined in Fig. 1.
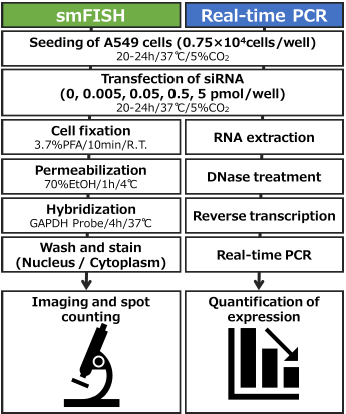
Fig. 1. Schematic overview of experiment
Single-molecule RNA visualization using smFISH
The smFISH method is a molecular biology technique that enables highly sensitive visualization of RNA in cells and tissues. This technique relies on fluorescently labeled complementary probes that hybridize to RNA, allowing detection of RNA localization and expression levels at the single-molecule level (Fig. 2). The probes are designed to target specific RNA sequences and typically consist of multiple oligonucleotides approximately 18–22 nucleotides in length. This design reduces background signals and enhances specificity. As a technique capable of visualizing RNA at the single-molecule level, smFISH is widely used for analyzing RNA dynamics and quantifying RNA expression within cells. In this application note, we utilized Stellaris RNA FISH probes from LGC Biosearch Technologies, which are characterized by their high sensitivity, high specificity, and user-friendly protocol.
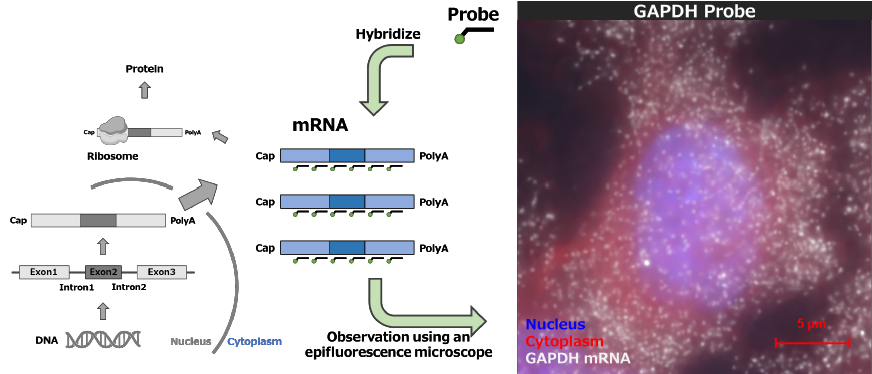
Fig. 2. Schematic diagram of the smFISH
Created with BioRender ( Https://www.biorender.com/ )
Cell-to-cell heterogeneity in siRNA-mediated knockdown
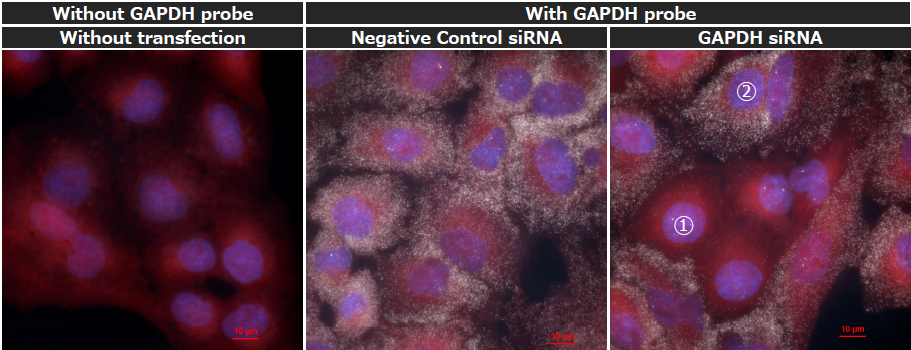
Knockdown experiments using GAPDH siRNA were performed and the resulting effect within the cell population was visualized using smFISH. The GAPDH mRNA fluorescence images reveal a heterogeneous population state (Fig. 3), where cells with reduced numbers of GAPDH mRNA spots (①) appear alongside cells showing no significant change in spot numbers (②). This result suggests that there are significant differences in the intracellular delivery efficiency of siRNA among individual cells.
A highly-sensitive, image-based technique captures data at the single-cell level rather than bulk population data, which can provide critical insights into the efficacy of new siRNA treatments.
Fig. 3. smFISH images of GAPDH mRNA in A549 cells after GAPDH siRNA transfection
Fluorescence staining for nucleus: DAPI (blue), cytoplasm: HCS Cell Mask DeepRed Stain (Red), GAPDH mRNA: Quasar570 (white). Images were acquired using a 100x oil immersion objective lens.
Left: No siRNA transfection, no treatment with GAPDH probe.
Center: Transfection of Negative Control siRNA with GAPDH probe treatment.
Right: Transfection of GAPDH siRNA with GAPDH probe treatment. ①: cells with reduced GAPDH mRNA spots; ②: cells with unchanged spot numbers.
Quantification of knockdown efficiency using smFISH and image analysis
To confirm the quantitative accuracy of knockdown efficiency using smFISH and image analysis, we performed a comparison with real-time PCR. For the smFISH analysis, an inverted microscope (ECLIPSE Ti2-E) and the image analysis module General Analysis 3 (GA3) were used to quantify the number of GAPDH mRNA spots in each cell (Fig. 4A). For real-time PCR, the expression level of GAPDH mRNA was measured using the relative standard curve method.
The analysis revealed considerable variation in the number of spots among cells. The number of cells with reduced spots increased in a GAPDH siRNA concentration-dependent manner (Fig. 4B). Furthermore, the number of spots quantified using GA3 showed a strong correlation with the relative expression levels measured by real-time PCR (R² = 0.99). This confirms that the smFISH can evaluate knockdown efficiency with accuracy comparable to that of real-time PCR (Fig. 4C). Additionally, analysis showed that at least 700 cells are required to keep the coefficient of variation (CV) below 10% (Fig. 4D).
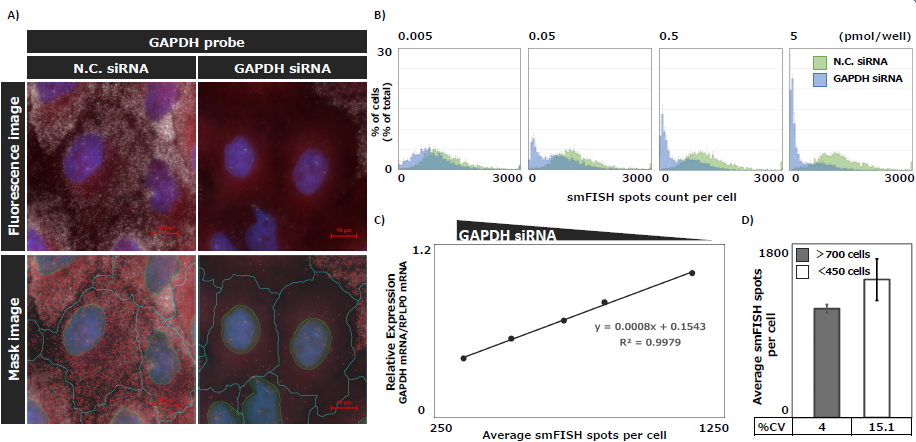
Figure 4. Quantification of the knockdown effect of GAPDH siRNA in a concentration-dependent manner using smFISH
A) Representative fluorescence images of GAPDH mRNA spots per cell in A549 cells transfected with siRNA, acquired using a 100x oil immersion objective lens.
Top: Overlay of nuclei (blue, DAPI), cytoplasm (red, HCS Cell Mask DeepRed Stain), and GAPDH mRNA (white, Quasar570). Bottom: Mask images showing nuclei (yellow), cytoplasm (blue), and GAPDH mRNA (red). B) Histograms showing the number of GAPDH mRNA spots per cell in the population after treatment with varying concentrations of GAPDH siRNA. C) Comparison between the number of GAPDH mRNA spots per cell quantified by smFISH and the relative expression levels of GAPDH mRNA measured by real-time PCR. D) Statistical reliability based on the number of analyzed cells. The mean ± SD of control samples (non-transfected with siRNA) is represented as bar graphs with error bars, and the %CV is shown in the accompanying table.
Single-cell analysis of siRNA delivery efficiency and knockdown efficiency
Using smFISH, GAPDH mRNA spot counts were analyzed to determine the proportion of cells exhibiting GAPDH siRNA delivery (delivery efficiency) and the number of spots in those cells (knockdown efficiency).
A threshold was set using control samples not transfected with siRNA by calculating the mean minus 2SD from histograms normalized via the IQR method (Fig. 5A). Delivery and knockdown efficiencies were then calculated as described in Fig. 5B. The results showed GAPDH siRNA delivery efficiency increased in a concentration-dependent manner, while knockdown efficiency remained consistently high and stable in siRNA-transfected cells (Fig. 5C). Comparison of relative GAPDH mRNA expression levels measured by real-time PCR and siRNA delivery efficiency revealed a strong correlation (R² = 0.95, Fig. 5D). These results indicate that the siRNA concentration-dependent decrease in mRNA expression observed via real-time PCR is not a uniform phenomenon across the cell population. Instead, it reflects the heterogeneous nature of the population, driven by changes in the proportions of cells classified into categories such as group ① and group ② in Fig. 5. Thus, smFISH appears to be a capable analytical approach for capturing the heterogeneous effects of siRNA that were previously overlooked by conventional methods, demonstrating its utility as a valuable tool for siRNA therapeutic analysis (Fig. 5E).
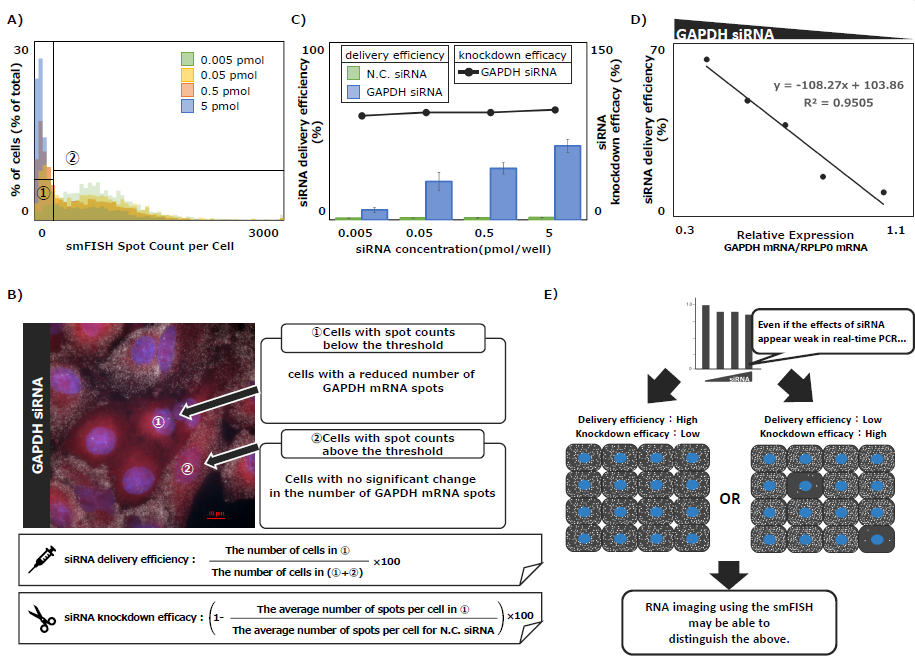
Figure 5. Evaluation of Delivery Efficiency and Knockdown Efficiency of GAPDH siRNA
A) Histograms of GAPDH mRNA spot counts in cells transfected with each concentrations of GAPDH siRNA. A threshold was determined by calculating the mean minus 2SD from histograms normalized using the IQR method, based on control samples that were not transfected with siRNA. B) Explanation of the calculation formulas used to determine the delivery efficiency and knockdown efficiency of GAPDH siRNA, based on the threshold in (A). C) Delivery (bar graph) and knockdown efficiency (graph) of GAPDH siRNA calculated from (B). D) Comparison of GAPDH siRNA delivery efficiency with relative GAPDH mRNA expression levels measured by real-time PCR. E) Illustration of the utility of RNA imaging using the smFISH method. Created with BioRender (https://www.biorender.com/).
Summary
In this application note, we demonstrated that imaging-based approaches enabled high-precision visualization and quantification of the knockdown efficiency and delivery efficiency of siRNA at the single-cell level, which could not be captured by conventional real-time PCR. In particular, the smFISH method, which allows RNA visualization at the single-molecule level, showed an advantage in distinguishing subtle differences in cellular responses while maintaining similar quantitative ability compared to real-time PCR. This provides new perspectives for the design and optimization of nucleic acid-based drugs, where studying drug responsiveness and localization at the single-cell level is critical. The imaging-based smFISH method is expected to serve as a reliable evaluation tool that contributes to accelerating drug discovery efforts.
Author : Tomoko Hayakawa and Mika Shirato, NIKON Corporation
Product Information
ECLIPSE Ti2 series
inverted microscope
A large, 25 mm FOV enables efficient acquisition of samples over a wide area in each image. Different models are available to meet varying research needs, from fully manual control, to added intelligent assistance features, to a fully motorized model capable of automated, multidimensional acquisition.


스펙