
A practical assessment of analytical performances for pseudoislet morphology by GA3 and other image analysis tools
The advent of three-dimensional (3D) cell cultures, including spheroids and organoids, has revolutionized cell biology research by providing more accurate tissue representations. However, the cultivation and analysis of these complex structures present significant challenges. In their recent research publication, Dr. Rademakers and colleagues evaluated three microwell culture plate designs and four image analysis software packages, including Nikon's GA3, for their efficacy in 3D culture analysis. Their findings reveal that Nikon's GA3 demonstrated superior versatility and accuracy in quantifying nuclei and cells within 3D cultures. It also excelled in classifying cell localization, outperforming open-access alternatives that often require extensive post-processing optimization.
This application note provides critical insights for researchers employing microscopic imaging in 3D cell culture analysis, highlighting the advantages of Nikon's advanced imaging systems and software solutions. Their findings underscore the importance of selecting appropriate tools and methodologies to maximize the potential of 3D cell culture research in advancing biological understanding.
NIS-Elements
Study overview
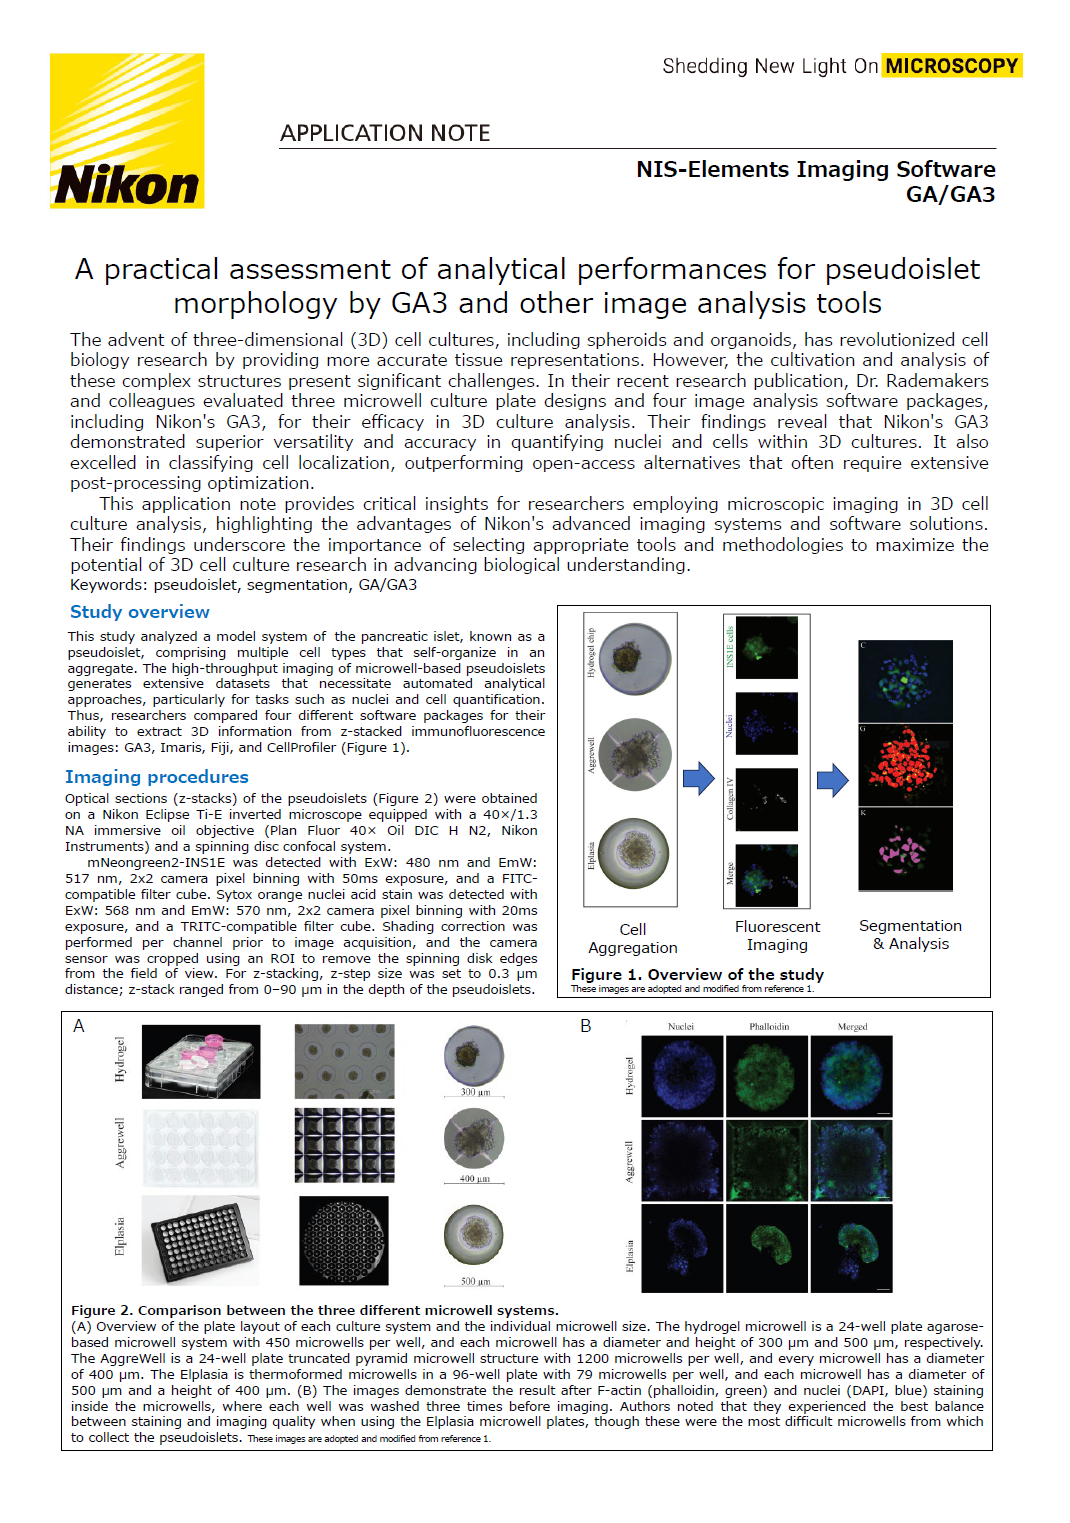
This study analyzed a model system of the pancreatic islet, known as a pseudoislet, comprising multiple cell types that self-organize in an aggregate. The high-throughput imaging of microwell-based pseudoislets generates extensive datasets that necessitate automated analytical approaches, particularly for tasks such as nuclei and cell quantification. Thus, researchers compared four different software packages for their ability to extract 3D information from z-stacked immunofluorescence images: GA3, Imaris, Fiji, and CellProfiler (Figure 1).
Imaging procedures
Optical sections (z-stacks) of the pseudoislets (Figure 2) were obtained on a Nikon Eclipse Ti-E inverted microscope equipped with a 40x/1.3 NA immersive oil objective (Plan Fluor 40x Oil DIC H N2, Nikon Instruments) and a spinning disc confocal system.
mNeongreen2-INS1E was detected with ExW: 480 nm and EmW: 517 nm, 2x2 camera pixel binning with 50ms exposure, and a FITC-compatible filter cube. Sytox orange nuclei acid stain was detected with ExW: 568 nm and EmW: 570 nm, 2x2 camera pixel binning with 20ms exposure, and a TRITC-compatible filter cube. Shading correction was performed per channel prior to image acquisition, and the camera sensor was cropped using an ROI to remove the spinning disk edges from the field of view. For z-stacking, z-step size was set to 0.3 μm distance; z-stack ranged from 0-90 μm in the depth of the pseudoislets.
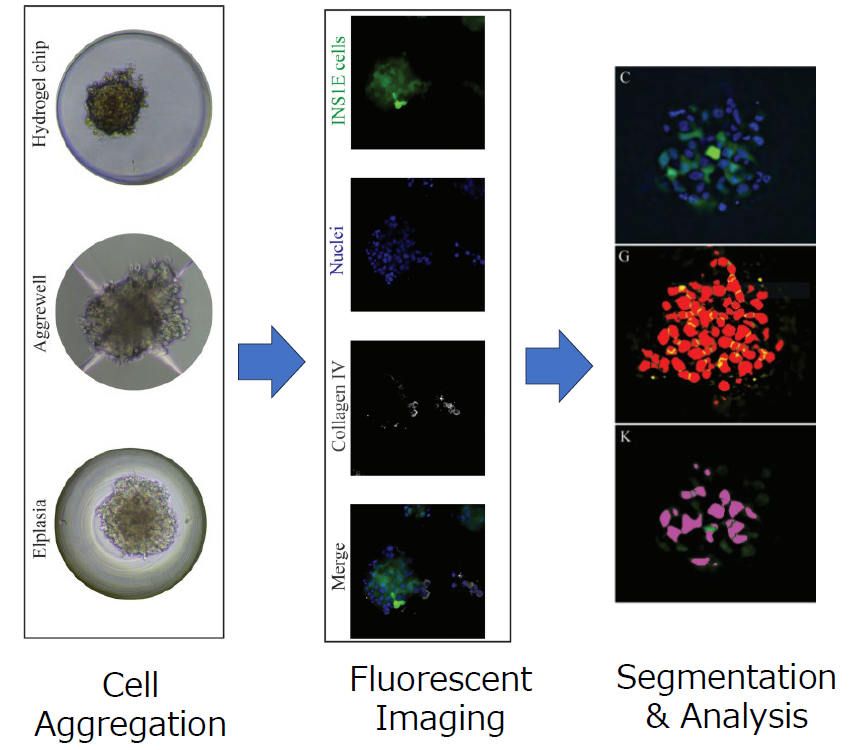
Figure 1. Overview of the study
These images are adopted and modified from reference 1.
Figure 2. Comparison between the three different microwell systems.
(A) Overview of the plate layout of each culture system and the individual microwell size. The hydrogel microwell is a 24-well plate agarose-based microwell system with 450 microwells per well, and each microwell has a diameter and height of 300 μm and 500 μm, respectively. The AggreWell is a 24-well plate truncated pyramid microwell structure with 1200 microwells per well, and every microwell has a diameter of 400 μm. The Elplasia is thermoformed microwells in a 96-well plate with 79 microwells per well, and each microwell has a diameter of 500 μm and a height of 400 μm. (B) The images demonstrate the result after F-actin (phalloidin, green) and nuclei (DAPI, blue) staining inside the microwells, where each well was washed three times before imaging. Authors noted that they experienced the best balance between staining and imaging quality when using the Elplasia microwell plates, though these were the most difficult microwells from which to collect the pseudoislets. These images are adopted and modified from reference 1.
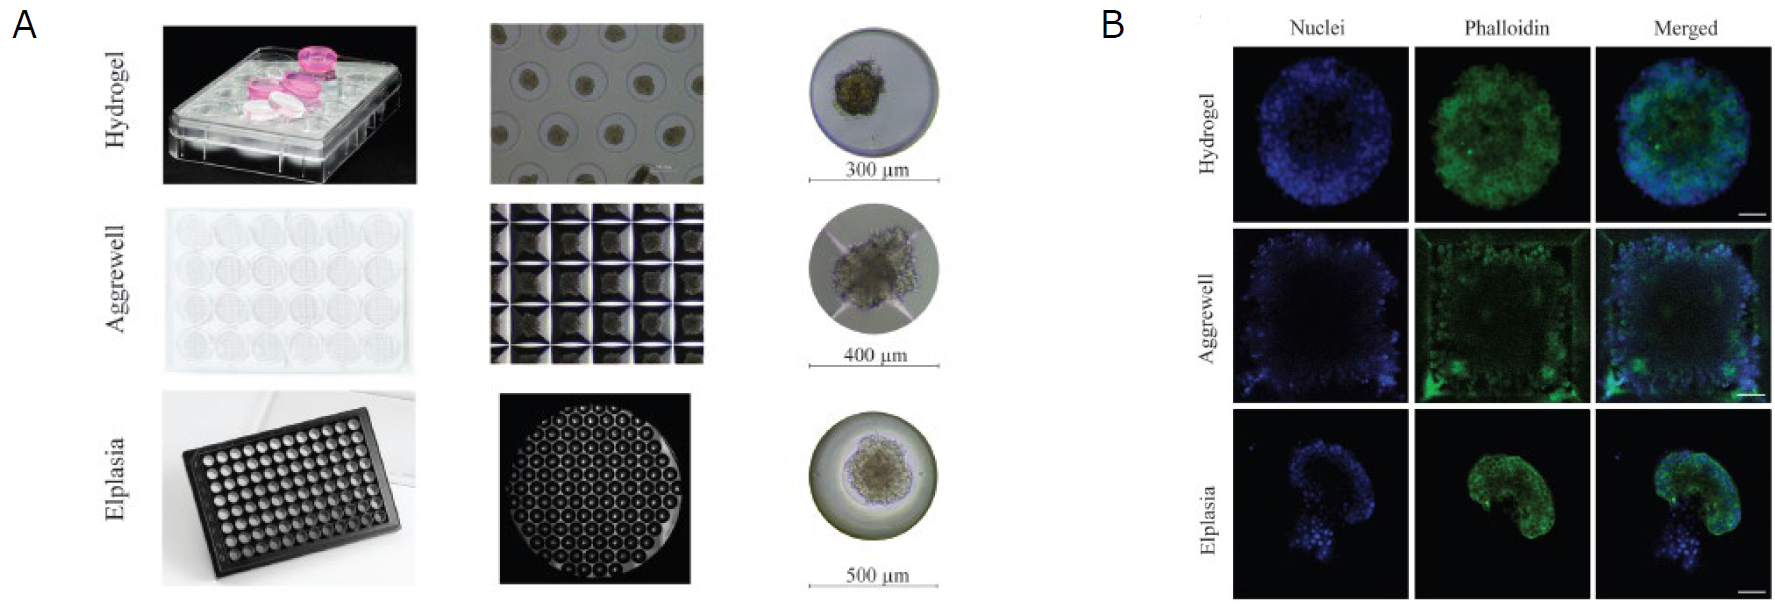
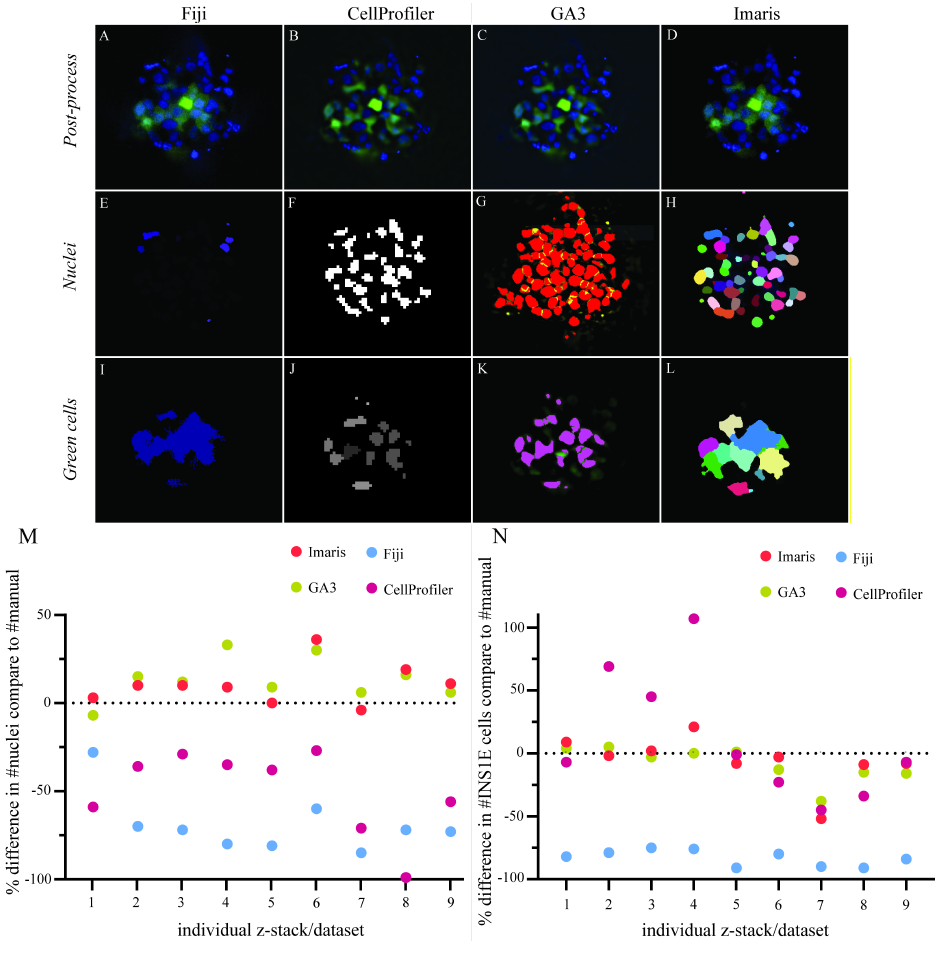
Figure 3. Comparison of the software performance for segmentation and quantification.
(A-D) Post-processed images of the aggregated INS1E cells (green) and nuclei (blue) with applied background noise reduction and immunofluorescence signal normalisation by each software. (E-H) The threshold segmentation of individual nuclei ID represents the thresholding success for all four software. (I-L) Focus on cell segmentation between single cells in the aggregate and how well each of the four different software could identify single cells. (M) The software was compared to manual counting for their performance to quantify nuclei and correct for multiple counts. The data represent an over- or underestimated count of nuclei in the different images containing aggregates of cells. The software GA3 and Imaris overestimated the count of nuclei with an average of 13% and 10%, respectively. Fiji and CellProfiler underestimated the count of nuclei with an average of 69% and 50%, respectively. (N) A comparison between the software for their success segmenting single cells in the cell clusters. GA3 and Imaris had close quantifications to the manual cell count with a slight underestimation of 8% and 6%, respectively. CellProfiler showed results close to GA3 and Imaris along with larger variation in over- and underestimations of the cell count with an average of 12% overestimation. Fiji showed a consistent underestimation of the cell count with an average value of 83% from the manual count. Results are calculated by the relative change, and the data comprised nine z-stack data sets.
These images are adopted and modified from reference 1.
Comparison of image analysis software performances
Each software utilized post-processing background noise removal (Fig 3A-D). In this application, the CellProfiler post-process plugin solution was not effective to improve nucleus or cell detection. Therefore, the GA3 post-processed images were used for the CellProfiler analysis to improve the segmentation of the nuclei and cells. Fiji, GA3 and Imaris applied rolling ball background subtraction to isolate the fluorescence signal from the background noise and enhance the signal-to-noise ratio (Fig 3A, C, D). In addition, Imaris normalised the fluorescence signal between every z-stack image to compensate for signal loss further into the tissue (Fig 3D). GA3 applied identical intensity compensation and a Gaussian Laplace filter to enhance the borders of nuclei and cells (Fig 3C). Manual thresholding was performed to quantify nuclei and INS1E cells in the pseudoislets (Fig 3E-H). Quantification of the INS1E cells showed a similar ability of CellProfiler and GA3 to extract the INS1E cells (Fig 3I, J). Both GA3 and Imaris quantified INS1E very close to manual counting, with underestimations of 8% and 6%, respectively. CellProfiler performed better in INS1E cell detection than nuclei quantification, which had a 12% overestimation in cell detection compared to manual counting. However, the variability was high between the different samples (Fig 3N). Imaris and Fiji could less clearly distinguish cell borders, causing an expanded fluorescence area estimation, which resulted in larger masks. However, Imaris achieved better cell separation than Fiji, which resulted in an accurate cell count, as the cell clusters were separated into single cells (Fig 3I, L). Fiji underestimated the number of INS1E cells in the pseudoislet by 83% compared to the manual count.
For quantification of nuclei, Fiji was less capable of quantifying the nuclei located in the inner core of the pseudoislet (Fig 3E). CellProfiler and Imaris showed similar masking of nuclei, although Imaris could better separate nuclei in close proximity to each other (Fig 3F, H). GA3 identified more nuclei and showed good separation between closely localized nuclei (Fig 3G). Overall, the performance of the four different software packages in quantifying nuclei resulted in two groups. The first group, GA3 and Imaris, overestimated nuclei, with 13% and 10% overestimations, respectively, compared to manual quantification. In the second group, CellProfiler and Fiji both underestimated the number of nuclei in the pseudoislets, with 50% and 69% underestimations, respectively (Fig 3M). Overall, Fiji substantially underestimated both INS1E cells and nuclei compared to manual counting.
Conclusions
The assessment of the four different software packages has extended our knowledge about the performance and limitations when using software solutions to analyze 3D datasets. The insights gained from the comparisons between the software may assist other researchers. Commercial software, GA3 and Imaris, outperformed Fiji and CellProfiler. When designing a research question, authors suggest that clearly defining the required analyses and executing initial testing could be valuable, as software such as Fiji and CellProfiler can still be well adapted for 3D cell quantification with necessary extensive optimization. Nonetheless, GA3 and Imaris provided faster solutions with a user-friendly interface without training, and after a short learning curve, they provided a post-process solution that improves the segmentation of cells. Importantly, authors note that “in our experience, GA3 had a better functional interface to automatically apply the defined region of core/mantle in every dataset compared to Imaris, which required additional manual input.
” Thus, GA3 outperformed several of the competing softwares they have tested.
Acknowledgments
We would like to express our deepest gratitude to Drs Fredrik Wieland, Anika Schumacher, Nadia Roumans, Clemens van Blitterswijk, Vanessa LaPointe and Timo Rademakers of MERLN Institute for Technology-Inspired Regenerative Medicine, Maastricht University, Maastricht, The Netherlands for providing images and research information in preparing this application note.
Edited by Shingo Nagawa, Nikon Corporation
References
1. Methodological approaches in aggregate formation and microscopic analysis to assess pseudoislet morphology and cellular interaction
Wieland F, Schumacher A, Roumans N, van Blitterswijk C, LaPointe V, Rademakers T.
Open Res Eur Eur. 2022 Sep 20;2:87.
DOI: ( https://doi.org/10.12688/openreseurope.14894.2 )
Product Information
General Analysis (GA)/General Analysis 3 (GA3) analysis module
An optional software for customizing the automation of image analysis. GA3 can customize automation of analytical and statistical processing of complex workflows such as 3D volume imaging and 4D tracking.
Compatible software packages: NIS-Elements AR, C and C-ER
스펙
