Feedback microscopy using Nikon AX confocal microscopy and JOBS software to bridge mm to µm structures
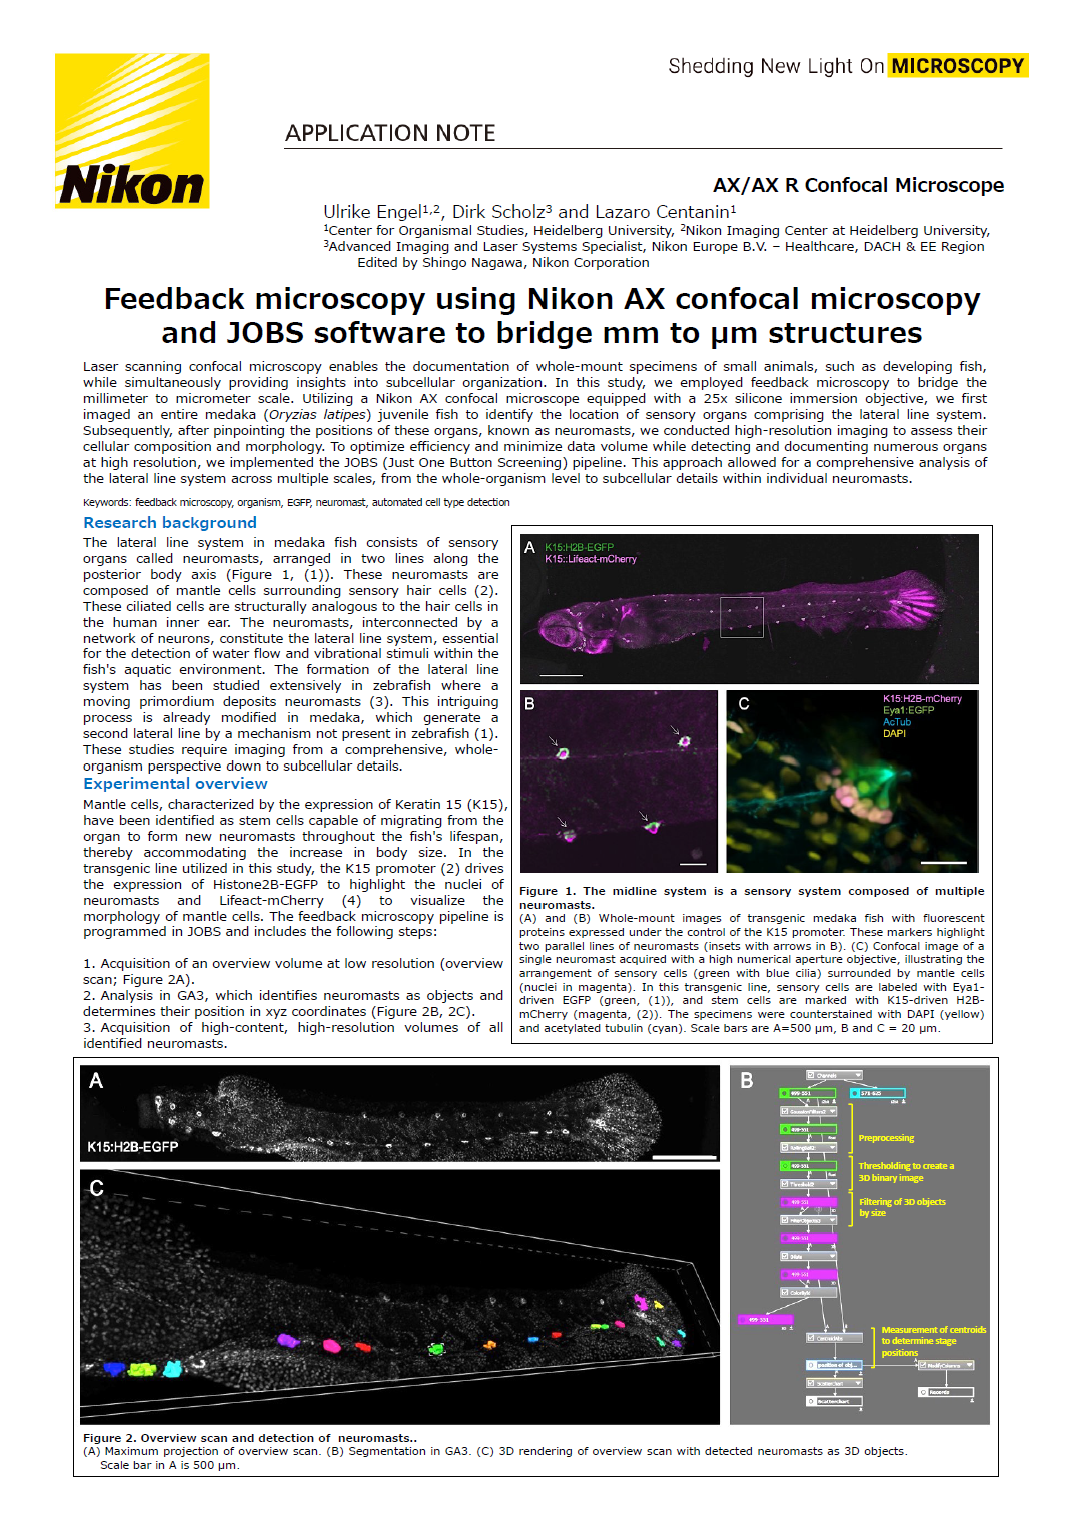
Laser scanning confocal microscopy enables the documentation of whole-mount specimens of small animals, such as developing fish, while simultaneously providing insights into subcellular organization. In this study, we employed feedback microscopy to bridge the millimeter to micrometer scale. Utilizing a Nikon AX confocal microscope equipped with a 25x silicone immersion objective, we first imaged an entire medaka (Oryzias latipes) juvenile fish to identify the location of sensory organs comprising the lateral line system. Subsequently, after pinpointing the positions of these organs, known as neuromasts, we conducted high-resolution imaging to assess their cellular composition and morphology. To optimize efficiency and minimize data volume while detecting and documenting numerous organs at high resolution, we implemented the JOBS (Just One Button Screening) pipeline. This approach allowed for a comprehensive analysis of the lateral line system across multiple scales, from the whole-organism level to subcellular details within individual neuromasts.
Keywords: feedback microscopy, organism, EGFP, neuromast, automated cell type detection
Research background
The lateral line system in medaka fish consists of sensory organs called neuromasts, arranged in two lines along the posterior body axis (Figure 1, (1)). These neuromasts are composed of mantle cells surrounding sensory hair cells (2). These ciliated cells are structurally analogous to the hair cells in the human inner ear. The neuromasts, interconnected by a network of neurons, constitute the lateral line system, essential for the detection of water flow and vibrational stimuli within the fish’s aquatic environment. The formation of the lateral line system has been studied extensively in zebrafish where a moving primordium deposits neuromasts (3). This intriguing process is already modified in medaka, which generate a second lateral line by a mechanism not present in zebrafish (1). These studies require imaging from a comprehensive, whole-organism perspective down to subcellular details.
Experimental overview
Mantle cells, characterized by the expression of Keratin 15 (K15), have been identified as stem cells capable of migrating from the organ to form new neuromasts throughout the fish’s lifespan, thereby accommodating the increase in body size. In the transgenic line utilized in this study, the K15 promoter (2) drives the expression of Histone2B-EGFP to highlight the nuclei of neuromasts and Lifeact-mCherry (4) to visualize the morphology of mantle cells. The feedback microscopy pipeline is programmed in JOBS and includes the following steps:
1. Acquisition of an overview volume at low resolution (overview scan; Figure 2A).
2. Analysis in GA3, which identifies neuromasts as objects and determines their position in xyz coordinates (Figure 2B, 2C).
3. Acquisition of high-content, high-resolution volumes of all identified neuromasts.
Figure 1. The midline system is a sensory system composed of multiple neuromasts.
(A) and (B) Whole-mount images of transgenic medaka fish with fluorescent proteins expressed under the control of the K15 promoter. These markers highlight two parallel lines of neuromasts (insets with arrows in B). (C) Confocal image of a single neuromast acquired with a high numerical aperture objective, illustrating the arrangement of sensory cells (green with blue cilia) surrounded by mantle cells (nuclei in magenta). In this transgenic line, sensory cells are labeled with Eya1-driven EGFP (green, (1)), and stem cells are marked with K15-driven H2B-mCherry (magenta, (2)). The specimens were counterstained with DAPI (yellow) and acetylated tubulin (cyan). Scale bars are A=500 µm, B and C = 20 µm.
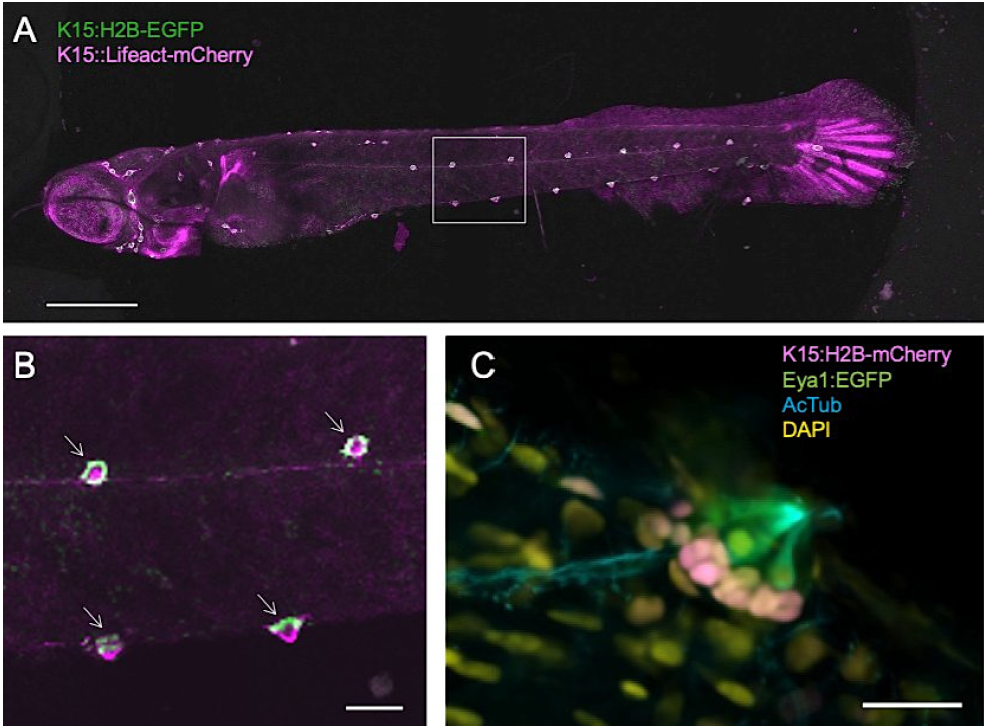
Figure 2. Overview scan and detection of neuromasts.
(A) Maximum projection of overview scan. (B) Segmentation in GA3. (C) 3D rendering of overview scan with detected neuromasts as 3D objects.
Scale bar in A is 500 µm.
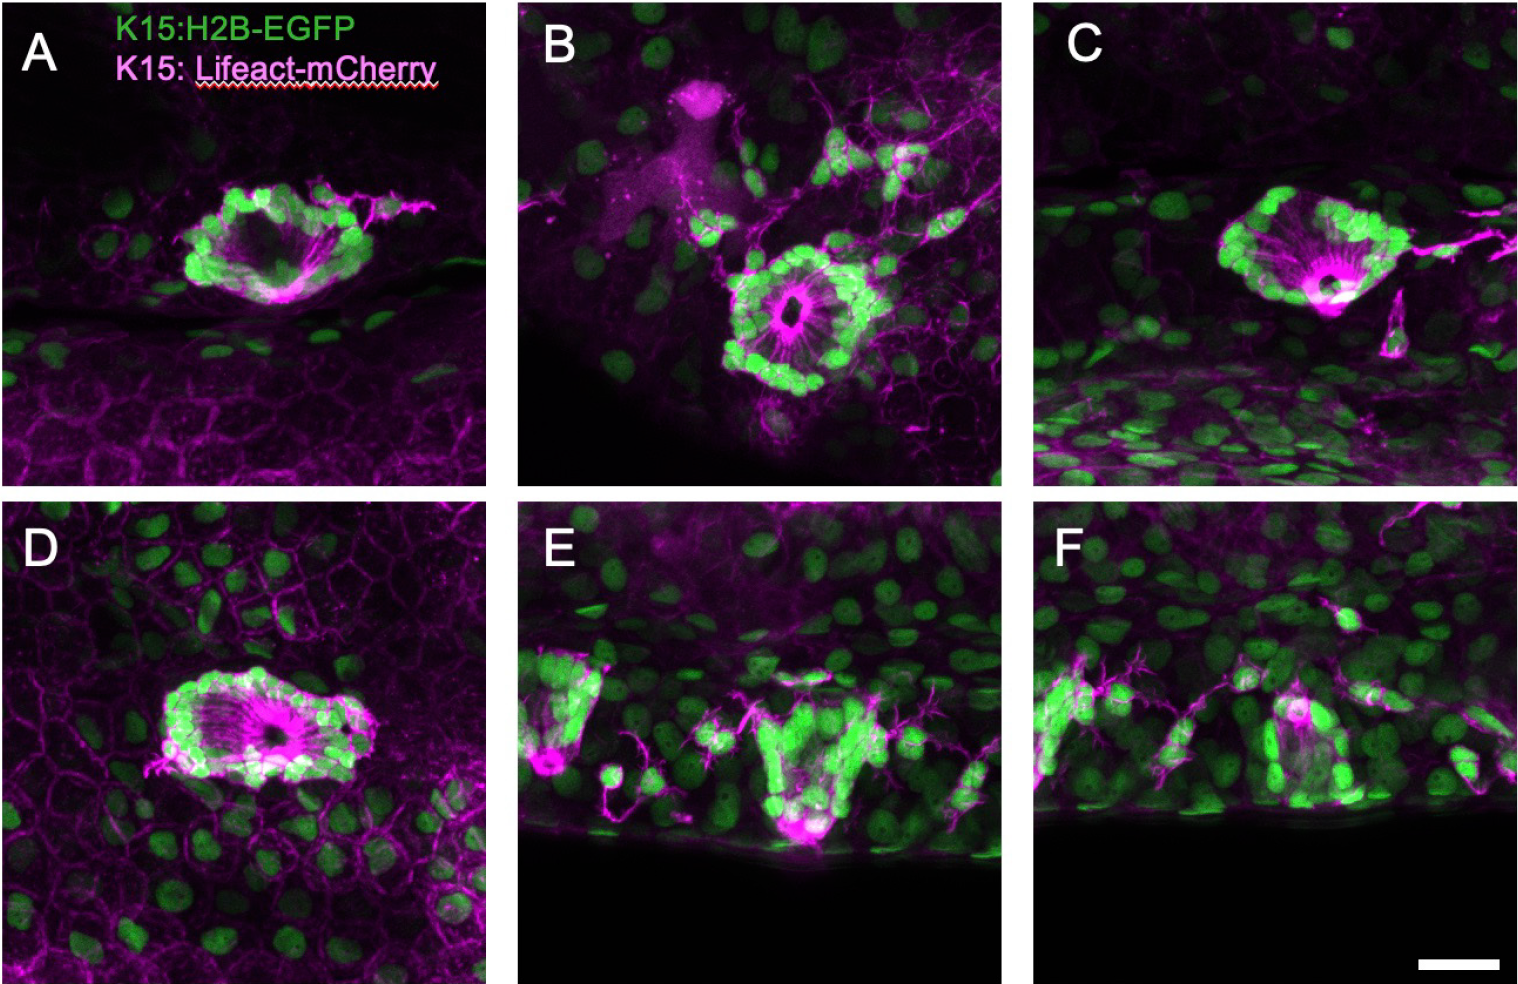
Figure 3. Examples of neuromasts acquired in high resolution scans after automated detection.
Volumes are shown as maximum projection. Scale bar is 20 µm.
Detailed description of experimental process
1. Overview and high-content imaging were performed using a 25x silicone immersion objective (Plan Apo Lambda S 25XC SiL; NA 1.05). The overview scan comprised 10 tiles with coarse sampling (2100 x 256 pixels, 2.76 µm pixel size), covering the entire fish (1.4 x 6 mm) and a depth of 140 µm in 24 steps. This initial scan was completed within minutes.
2. In the resulting volume (Figure 2A), the nuclear signal was utilized to identify neuromast positions, generating a point list with xyz coordinates for subsequent high-resolution scanning. It is noteworthy that K15 is expressed in epithelial cells, particularly in fins; however, its expression is highest in neuromasts, where positive cells assemble in a distinctive ring structure, enabling identification of these organs as 3D objects (Figure 2B).
The analysis pipeline consisted of the following steps:
- Gaussian Filter (smoothing)
- Rolling Ball Subtraction (local background subtraction)
- Thresholding (to create a 3D binary image)
- Filtering of 3D objects by size (to exclude unwanted objects)
- Measurement of centroids to determine stage positions
A key feature of the GA3 software is its interactive initial setup, allowing for optimization of settings to refine the analysis pipeline.
3. The generated point list facilitated high-resolution scanning of individual neuromasts, enabling detection of K15-positive mantle cell morphology (Figure 3). This volume was acquired with a 0.23 µm pixel size, leveraging the high resolution of the silicone immersion objective. Despite acquiring multiple volumes, imaging of 25 neuromasts was completed in 17 minutes. This efficiency is attributed to the high xy precision of object detection, permitting the use of a high zoom factor: the scanned volume was 120 µm x 120 µm at 512 x 512 resolution, ensuring precise neuromast coverage.
K15-positive cells form a rosette around the sensory cells, their shape accentuated by the actin label, revealing apical constriction of mantle cells surrounding the cilium (Figure 3). The number of mantle cells varies between organs. In addition to their characteristic shape, K15-positive cells exhibit protrusions indicative of their migratory role. This is particularly evident in Figure 3E and F.
Summary and outlook
Feedback microscopy enables the efficient extraction of high-content information in an unsupervised manner. Compared to scanning the entire fish at high resolution, object identification conserves both microscope time and data storage while reducing unnecessary photobleaching. The pipeline setup within the NIS-Elements software, utilizing JOBS and GA3 analysis modules, allows for the establishment of the entire workflow without the need for custom scripting. However, as with all automated imaging protocols, rigorous testing of individual steps is essential to ensure success and robustness.
The current pipeline could be further expanded to include time-lapse imaging, rather than relying solely on single high-resolution z-stack acquisition. While this study used fixed juvenile fish, the genetically encoded markers are suitable for live imaging in sedated fish. Alternatively, the high-resolution image content could be enriched through immunocytochemistry (as illustrated in Figure 1C), enabling the visualization of all nuclei (via DAPI staining) and the connections between neuromasts and nerves (via acetylated tubulin staining).
This approach has a high potential in developmental biology and neuroscience. Medaka and zebrafish combine ease of breeding and perfect imaging conditions. However, imaging and analysis pipelines need to be adapted by researchers, typically biologists, to fit their specific experiment. The graphical programming interface of JOBS enables custom, automated routine creation without the need to write code.
References
Seileit, A., I. Kramer, E. Ambrosio, N. Dross, U. Engel, and L. Centanin. 2017. Sequential organogenesis sets two parallel sensory lines in medaka. Development. 144: 687-697.
Seileit, A., I. Kramer, B.F. Riebesel, E.M. Ambrosio, J.S. Stolper, C.Q. Lischik, N. Dross, and L. Centanin. 2017. Neural stem cells induce the formation of their physical niche during organogenesis. Elife 6.
Maas, P., and D. Gilmour. 2006. Chemokine signaling mediates self-organizing tissue migration in the zebrafish lateral line. Dev Cell. 10: 673-680.
Seileit, A., K. Gross, J. Onistschchenko, O.P. Hoang, J. Theelke, and L. Centanin. 2022. Local tissue interactions govern pLL patterning in medaka. Dev Biol. 481: 1-13. doi: 10.1016/j.ydbio.2021.09.002
Acknowledgment
U.E. would like to thank Nikon Europe B.V. for their continuous support of the Nikon Imaging Center at Heidelberg University.
JOBS graphical programming tool
An optional software that enables automatic operation by customizing the imaging flow by combining functions such as microscope control, acquisition, processing, and analysis of images, numerical calculation, conditional branching, and control of external devices.
General Analysis (GA)/General Analysis 3 (GA3) analysis module
An optional software for customizing the automation of image analysis. GA3 can customize automation of analytical and statistical processing of complex workflows such as 3D volume imaging and 4D tracking.
AX/AX R with NSPARC Confocal-based Super Resolution Microscope
The super-resolution detector NSPARC, which has a 25-detector array, achieves even higher resolution with a high S/N ratio, without impairing the functions of the conventional AX/AX R confocal microscope.
스펙