Imaging both H&E and immunofluorescence staining patterns on a single tissue section using the AX confocal laser microscope
Histopathological assessment traditionally relies on hematoxylin and eosin (H&E) staining for morphological evaluation, while immunohistochemistry provides critical molecular information for tumor classification and prognostication [1]. Current standard practice involves performing these techniques on consecutive tissue sections; however, this approach introduces inherent structural discrepancies that may compromise accurate correlation of morphological and molecular findings. The ideal solution would be to perform both H&E and immunofluorescence analyses on a single tissue section. However, the autofluorescence (550-650 nm) induced by H&E staining interferes with conventional fluorescence immunostaining using visible-light fluorophores, obscuring biomarker localization [2].
To resolve this issue, it is necessary to perform fluorescence immunostaining using fluorescent dyes with wavelengths that are spectrally distinct from the autofluorescence spectrum caused by H&E staining. Here, we demonstrate a method combining H&E staining with near-infrared fluorescence immunostaining on human lung cancer tissue. This approach allows for direct correlation between morphological features and molecular marker expression through integrated brightfield and fluorescence imaging modalities.
Keywords: tissue section, H&E staining, fluorescence immunostaining, confocal imaging
Summary of experiments
1. Fluorescence Immunostaining and H&E Staining of the Same Tissue Section
A 5 μm-thick section of paraffin-embedded human lung cancer tissue was used as the sample. Following heat-induced antigen retrieval, the section underwent fluorescence immunostaining, followed by H&E staining. For fluorescence immunostaining, ALK-1 protein was labeled using a mouse monoclonal anti-ALK-1 primary antibody (Abcam ab51870) and a goat anti-mouse secondary antibody conjugated to Alexa Fluor® 700 (Thermo Fisher A-21036).
2. Acquisition of H&E-Stained Images and Immunofluorescence Images from the Same Tissue Section
H&E-stained and immuno-stained samples were imaged using an inverted microscope system (Eclipse Ti2-E) equipped with a DS10 color camera and an AX-NIR confocal laser scanning microscope. Image acquisition, controlled by NISElements software, proceeded as follows: (1) Brightfield RGB images of H&E-stained samples were acquired using the DS10 camera under white light illumination. (2) Confocal fluorescence and laser transmission images of the same field of view were subsequently acquired using the AX-NIR system.
- Imaging Conditions
Objective lens: Plan Apo λD 20x (NA = 0.8)
Laser wavelength, detection wavelength, and power for confocal image acquisition:
Transmission image/autofluorescence: 561 nm, 585-628 nm, 5% (transmission image is direct detection of 561 nm laser), ALK-1 (Alexa Fluor® 700): 638 nm, 700-750 nm, 10%
Scanner: Galvano scanner, Zoom magnification: 2x, Averaging: 4x
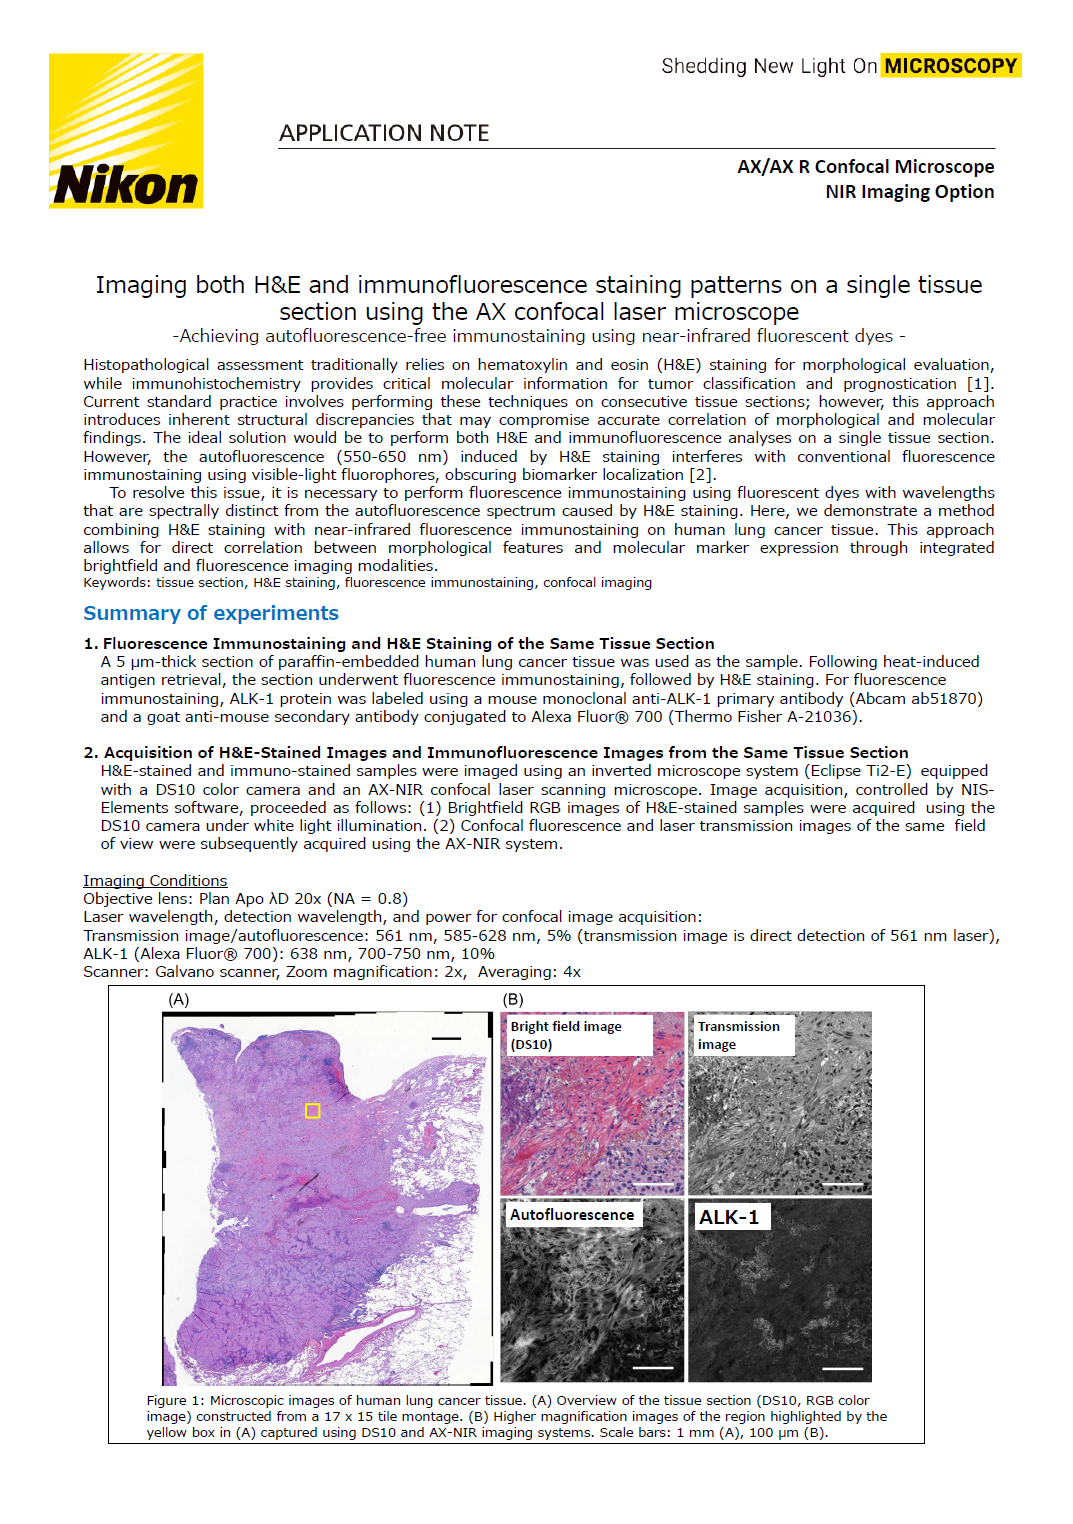
Figure 1: Microscopic images of human lung cancer tissue. (A) Overview of the tissue section (DS10, RGB color image) constructed from a 17 x 15 tile montage. (B) Higher magnification images of the region highlighted by the yellow box in (A) captured using DS10 and AX-NIR imaging systems. Scale bars: 1 mm (A), 100 μm (B).
Results and Discussion
A tiled, full-tissue overview brightfield image was acquired using NIS-Elements’ “Scan Large Image” function (Figure 1A). To visualize detailed structures, we acquired both brightfield and confocal images of the region highlighted by the yellow box (Figure 1B). Figure 1B displays a brightfield image (top left, acquired with a DS10 camera) alongside confocal images (remaining panels). Due to the differing field sizes and resolutions between the brightfield and confocal systems, images were processed to unify these parameters for comparison. Autofluorescence closely resembled the H&E staining pattern, with high autofluorescence intensity correlating strongly with regions stained red by eosin (Figure 1B). In contrast, the ALK-1 immunofluorescence signal displayed a distinct distribution, diverging from both the H&E staining and autofluorescence patterns.
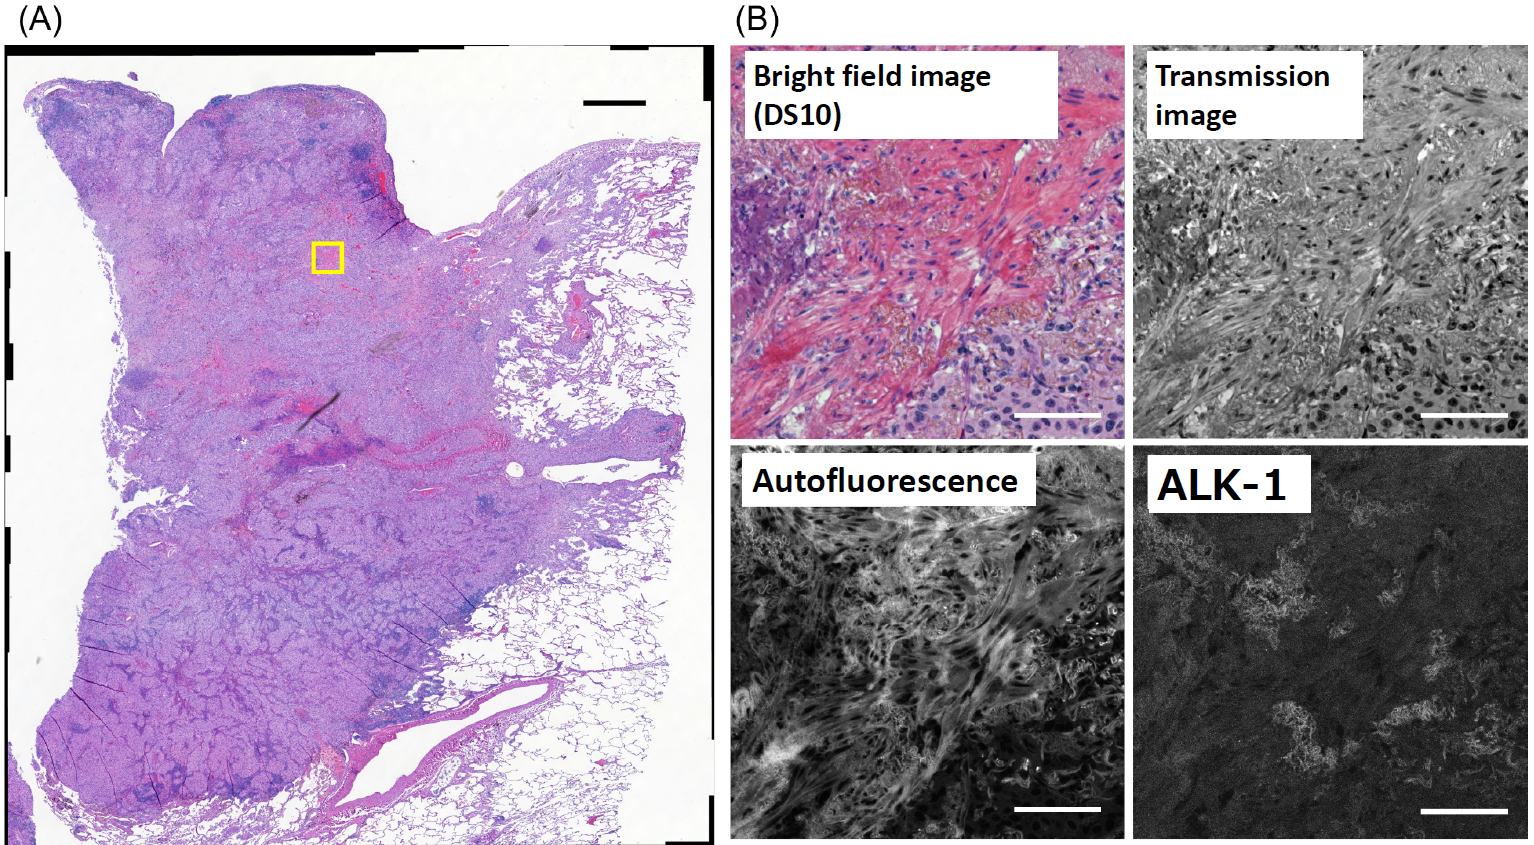
To elucidate the origin of the observed autofluorescence, we performed a comparative analysis using tissue sections processed only for ALK-1 immunofluorescence without H&E staining. Sections without H&E staining exhibited substantially lower autofluorescence levels (Figure 2), indicating that H&E staining is the primary contributor to the observed autofluorescence. Importantly, the distribution pattern and signal intensity of ALK-1 immunoreactivity remained unaltered regardless of H&E staining, demonstrating that H&E staining does not interfere with near-infrared fluorescence detection. H&E staining utilizes hematoxylin (stains nuclei blue-purple) and eosin (stains cytoplasm and stroma red). Eosin is known to be a major source of autofluorescence, while hematoxylin contributes minimally, if at all [1]. We therefore hypothesized that autofluorescence intensity would correlate with eosin staining. To assess this, we converted the RGB brightfield image in Figure 1B to HSV format using the GA3 image processing function in NIS-Elements, and isolated the Hue component. The Hue image, reflecting eosin staining intensity, showed a similar distribution to the autofluorescence image (Figure 3A, B), with a Pearson correlation coefficient of 0.48. This confirms the correlation between eosin staining and autofluorescence. In our samples, ALK-1-positive regions, although spatially restricted, exhibited substantial overlap with autofluorescent domains (Figure 3C). Using Alexa Fluor® 700, which has minimal spectral overlap with autofluorescence, allowed for clear visualization of ALK-1 without interference from autofluorescence (Figure 1B).
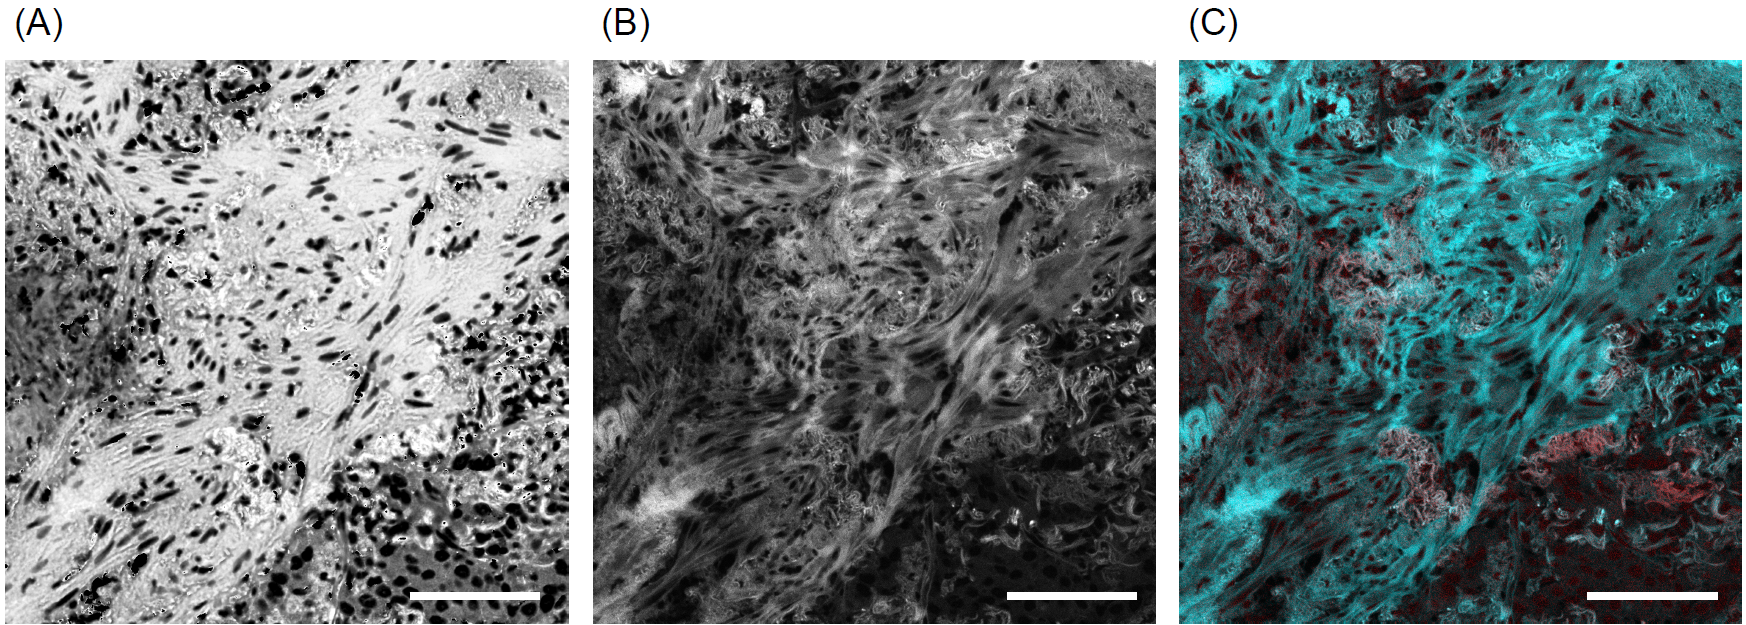
Figure 2: Autofluorescence (A) and ALK-1 immunofluorescence (B) images of human lung cancer tissue stained only for ALK-1 (omitting H&E staining). Scale bars: 100 μm.
Figure 3: (A, B) Comparison of the Hue component extracted from the brightfield image shown in Figure 1B (A) with its corresponding autofluorescence image (B), (C) Overlay of autofluorescence (cyan) and ALK-1 immunofluorescence (magenta) signals from Figure 1B. Scale bars: 100 μm
Conclusions
In this study, we demonstrated the effectiveness of near-infrared fluorophores for immunofluorescence imaging of H&E-stained tissue sections, as these fluorophores avoid spectral overlap with autofluorescence generated by H&E staining in the visible spectrum. Near-infrared light is traditionally utilized for deep tissue imaging due to its superior tissue penetration and for multicolor imaging in combination with visible fluorophores. Additionally, as shown here, near-infrared fluorophores can be employed to circumvent interference from autofluorescence. The AX confocal laser microscope system, equipped with the NIR option, enables detection of near-infrared fluorescence up to 800 nm, facilitating immunofluorescence imaging without autofluorescence interference. This method offers broad applicability, as various proteins can be labeled with NIR fluorophores using appropriate antibody combinations, irrespective of tissue type or target antigen.
References
1. Yugi et al. "An attempt to standardize hematoxylin-eosin staining: Color of hematoxylin-eosin staining most favored among pathological technologists and pathologists in the Chubu district based on the summary list of the questionnaire survey" (in Japanese) Japanese journal of medical technology Vol. 71(1) 120-129 (2022).
2. S. L. Gibbs et al., "Near-Infrared Fluorescent Digital Pathology for the Automation of Disease Diagnosis and Biomarker Assessment". Molecular Imaging. Vol. 14(5), (2015).
Authors
Junichi Kaneshiro, Shunsuke Takei and Shingo Nagawa, Nikon Corporation
Product information
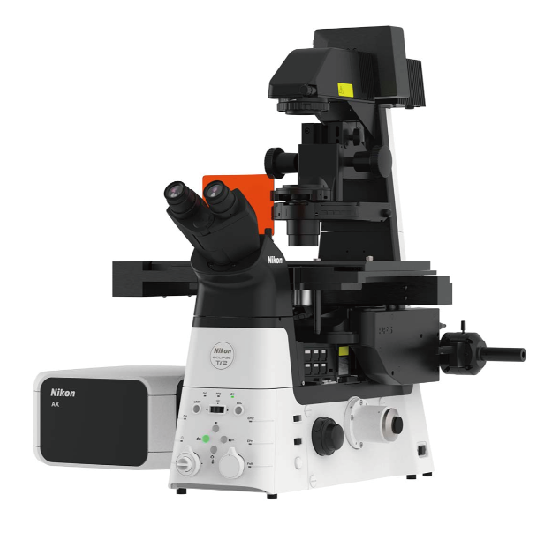
AX/AX R Confocal Microscope NIR Imaging Option
- High speed: Up to 720 fps (resonant at 2048 x 16 pixels)
- High resolution: Up to 8K (galvano) / 2K (resonant)
- High throughput: Ultra-wide FOV of 25 mm
- NIR imaging option that enables excitation at 730 nm or 785 nm, and two types of detector that can detect near-infrared light.

스펙